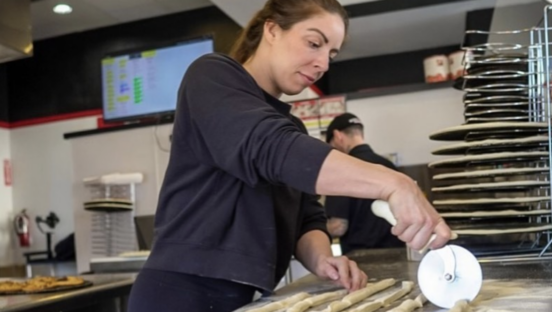

The numbers are in!
Results: More pizzerias opened this year than last year, industry sales are up and fewer stores closed compared to last year.
PMQ first started analyzing the pizza industry as a whole in 1997. We have made modifications to our analysis and information collecting processes to give you a more accurate picture of what is happening. Until this year, numbers for the total pizzerias in the U.S. were retrieved from Info USA using SIC Code 581222 and those businesses listing "pizza" in their name. There are many Italian food restaurants and pizzerias who choose to list themselves under different SIC Codes, but primarily sell pizza. To obtain a better picture of exactly how large the pizza industry is, Info USA has added only those restaurants listed with SIC Code 581208 that sell primarily pizza into the pizza counts and verified through extensive research and phone poles that those added did sell pizza. Now let's get to what the numbers say. The statistics we are providing are collected from the months spanning July 1, 2003 through July 1, 2004.
The Industry as a Whole
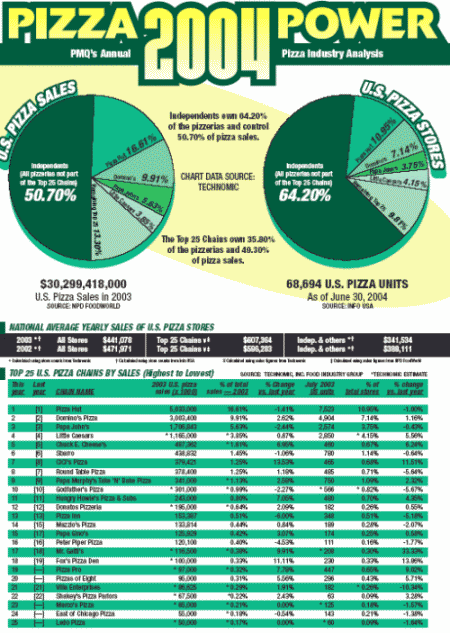
The good news is the total sales for the pizza industry rose 1 percent over last year. This year, the pizza industry captured $30,299,418,000 in sales. This is 6.88 percent of the total restaurant sales in the U.S., which was $440.1 billion. The bad news is the 68,694 pizzerias comprise 7.82 percent of all restaurants in the U.S. As you can see, pizzerias’ sales percentages are lower than their share of units.
On a more positive note, only 1,139 pizzerias went out of business in the past year, which is well below the 3,372 that closed in the same period before. There were 4,334 pizzerias that opened in that same period giving the industry a net gain of 3,195. Adding to this number are the 1,937 pizzerias that were reclassified as a pizzeria using part of SIC Code 581208. This gives the total number of pizzerias a 5,132 unit increase over last year's total.
Average store sales for the pizza industry this year were $441,078, which indicates a drop in average store sales. Once you consider the net gain of 3,195 pizzerias and the addition of those restaurants not included in the SIC Code used in the previous year’s report, the drop in average store sales is not as negative as the numbers show. Comparing the pizza industry’s average unit sales to the entire restaurant industry’s average unit sales show that pizzerias are below other restaurants, which average $501,253 in sales per unit. No one said pizza was the "get rich quick" career.
NPD Crest reports that servings of pizza at restaurants were down 1 percent in the past year. NPD Crest also reported that traffic at pizzerias was down 2 percent. What does this mean? Sales were stagnant, but growth in the number of units helped to fuel an increase in overall industry sales.


The Independents
As a result of adding restaurants that sell pizza but were not listed under SIC Code 58122, the independents and all others not listed in the Top 25 increased their share of total U.S. units to 64.2 percent, which is up from 60 percent in the same months in the previous year. In the past year, the independents captured more of the share of sales in the pizza industry than in the previous year. This year independents own 50.7 percent of the total industry sales versus last year’s 49.47 percent. The average sales per unit for independents and all others not listed in the Top 25 for the past year was $341,534, and shows a decrease from last year’s $389,111 in average unit sales. This may be explained by the growth in the industry and the addition of part of SIC Code 581208, which did not affect the counts in the Top 25.
The Top 25
The share of total industry sales for the Top 25 in the past year is 49.3 percent, which is down from last year’s 50.53 percent. The Top 25, which consists of 24,595 units, owns 35.8 percent of the total industry sales. This indicates that the Top 25 were able to capture more sales with fewer units than the independents.
Some interesting notes about the Top 25 can be seen in the following statistics. Seven of the Top 25 chains showed declines in sales, while 16 showed increases and two had no previous data to compare. Twelve of the Top 25 chains had declines in the number of units and 13 had increases in their number of units. There were five new entries into the Top 25 and they were: Pizza Pro, Pizzas of Eight, Marco’s Pizza, East of Chicago, and Ledo Pizza. There were five chains that moved up in the Top 25 rankings.
Here are some notable numbers for those chains who performed above average in the past year. Fox’s Pizza had an 11.11 percent rise in sales and 13.86 rise in units from the previous year. Chuck E Cheese’s sales were up 6.95 percent and total units were up 6.24 percent. Hungry Howie’s Pizza and Subs’ sales were up 7.05 percent and total units were up 4.35 percent. Hungry Howie’s did a nice job of increasing sales. For the first time in a while, Little Caesars reversed their trend of ending the year with fewer stores than the year before. This year, Little Caesars reported a 5.56 percent rise in units and also posted a 0.87 percent rise in sales…not earth-shattering growth, but it is a move in the opposite direction of recent years.
PMQ’s Pizza Industry Enterprise (PIE) Award Winner
PMQ would like to congratulate this year’s winner of the PIE Award, CiCi’s Pizza. CiCi’s Pizza had a 13.53 percent rise in sales and total units were up 11.51 percent. It was a close race between Hungry Howie’s and CiCi’s Pizza, but what helped CiCi’s tip the balance was their average sales per unit. CiCi’s averaged $815,959 in sales per unit.
Trends
The low-carb juggernaut appears to be the biggest trend of the past 12 months. It seems that the carb-avoiding Atkinites affected nearly every segment of the restaurant industry. Everyone from Donatos to Subway Sandwiches to Coca-Cola researched and launched some sort of low-carb alternative. While this trend seemed to peak early this year, there are indications that the mass appeal is starting to subside. Many low-carb specialty stores across the country have reported dramatic drops in sales in the past few months. Those operators who scrambled to offer low-carb alternatives at the peak of the trend were able to grab some of the dollars being spent and cashed in on the trend.
Closely related to the low-carb trend is the interest in healthy alternatives. Publicity in recent years about obesity lawsuits not only has some restaurant chains looking at changing their tune, but consumers are starting to think about health in determining what they order. Major chains like McDonald’s introduced a line of salads and other healthy choices. The sandwich category has traditionally been associated more with healthy eating than other restaurant categories and according to the Technomic Top 100 and Second 100, the sandwich category seems to be outperforming other segments. Quiznos had a unit growth rate of 46.7 percent and a 33 percent growth rate in sales. In terms of percentage of sales increase, the only chain to outperform Quiznos was the Chipotle brand. Subway had a 13.6 percent rise in units. The actual number of units Subway added in the past year was 695, which was the largest increase of all chains.
Another trend to watch is the frozen pizza segment. According to the Leading Edge Group’s report on pizza, Ready-to-Eat (RTE) pizza controls 88 percent of the total U.S. pizza sales while the frozen pizza segment controls 12 percent. While this number may seem small, it has grown immensely over the past decade. Whether it is a price factor or convenience factor, the fact is this segment continues to capture part of the RTE sales. Kraft Foods, Inc. holds a commanding share of the frozen segment with its “DiGiorno,” “Tombstone,” “Jack’s,” and “Boca” brands, as well as its agreement to sell the “California Pizza Kitchen” premium frozen pizza brand, according to the Leading Edge Group.
Conclusion
Several factors affected the pizza industry in the past year. Cheese prices went from record lows last year to record highs this year. Gas prices reached unseen highs and had an effect on the cost of goods delivered to your back door, but the restaurant industry hasn’t suffered. This marks the 13th consecutive year the National Restaurant Association (NRA) has reported real sales growth in the restaurant industry. The NRA reports that on a typical day in 2004, the industry is expected to post average sales of more than $1.2 billion. The restaurant industry sales are forecast to increase 4.4 percent over 2003, a real growth rate of 2 percent in real (inflation-adjusted) terms, which compares with a 1.3 real gain in 2003.