PMQ Pizza Magazine would like to thank all 490 pizza operators, suppliers and distributors who participated in our recent PMQ readers survey that measured the pizza industry’s COVID-19 disposition.
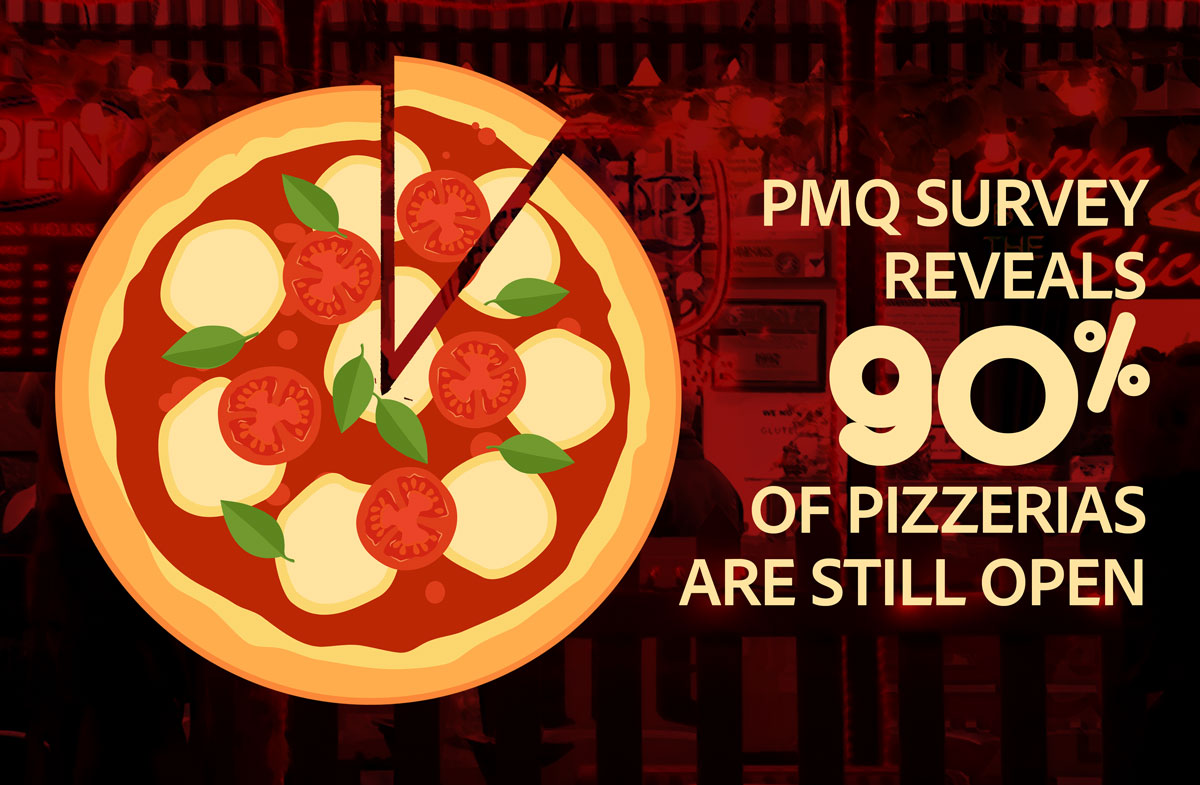
Of those 490 respondents, 97% were pizzeria operators, 81% were independent operators, 11.4% were franchises and 4.5% work in chain management. Moreover, 81.4% of respondents were the CEOs, presidents and owners of their pizzerias, and 10.8% were managers. Slightly over 90% (90.6%) of respondents’ pizzerias are still open, with less than 9% reporting that they had temporarily closed and less than one percent closing down permanently.
Below is a breakdown of all survey questions and some additional analysis from looking at the individual responses.
Question 1: Is your pizza restaurant still open?
Analysis: 90.6% of pizzerias are still open, 8.8% temporarily closed, and .62% permanently closed.
Question 2: Are your sales higher, lower or the same as before the pandemic?
Analysis: Sales patterns of the pizza business have been radically disrupted by COVID-19, revealing considerable pockets of opportunity.
42.24% of those surveyed said they have experienced higher sales or the same sales compared to before the coronavirus pandemic (25.92% higher and 16.33% same), while 55.9% report a decrease in sales. However, with sit-down dining virtually gone at the time the survey was conducted, there has been a significant increase in the carryout and delivery segment. Historically, the pizza industry gets about 1/3 of its sales from sit-down, 1/3 from carryout and 1/3 from delivery. With COVID-19, sales in the delivery and carryout segment have increased greatly at the expense of dine-in service, and many operators are adjusting to this demand shift with less payroll and costs.

Question 3: In order of importance, where are your sales coming from?
Analysis:
47.3% of respondents ranked carryout as the #1 source of sales
25.9% of respondents ranked delivery as their #1 source of sales
2.8% of respondents ranked take-and-bake as their #1 source of sales
2.4% of respondents ranked catering as their #1 source of sales
2% of respondents ranked dine-in as their #1 source of sales
19.4% of respondents didn’t rank any of these options as their #1 source of sales
Carryout and delivery are the significant sales sources at the moment as 73.2% of respondents ranked them as their top sales avenues.
Some operators are looking at how to increase future sales with more carryout options. Perhaps this plays into the propensity of the millennial willingness to adapt to DIY options such as carryout?
Question 4) What percentage of sales are coming from online ordering?
Analysis:
The good news is that 71.8% of pizza operations are accessible to customers online but 28.2% still are not. The two largest groups of pizza operators are either doing between 20% and 40% of sales (27.14%) or 0% (28.16%) with online ordering.
| None | 28.16% |
| Between 20 and 40% | 27.14% |
| Less than 20% | 22.44% |
| Between 40 and 60% | 13.46% |
| More than 60% | 8.77% |
The top 9% of the industry that are doing more than 60% online orders are not necessarily the technology-leading companies you’d think of, such as Domino’s, Papa John’s and Pizza Hut. Rather, they are independent pizzerias that have their own websites and also use a sprinkling of third-party ordering companies. It’s inspiring to see that independents who want to compete equally with the chains are doing it well and doing it now.
Meanwhile, nearly 50% of respondents (49.59%) report having less than 40% of sales coming from online ordering. Only 8.7% report having more than 60% sales come from online ordering, and 13.46% report getting between 40% and 60% of sales come from online ordering.
Question 5: What percentage of your sales come from phone-in orders?
| None | 6.32% |
| Less than 20% | 6.73% |
| Between 20 and 40% | 18.37% |
| Between 40 and 60% | 21.84% |
| Over 60% | 46.53% |
Analysis: The survey shows that 18% of respondents get more orders from online than from telephone while 65% say that they get more orders from the phone. 17% of the time they get an equal amount from both phone and online.
68.37% of the pizza industry reports that phone call orders make up over 40% of their sales at the moment. Still, 22.24% reports over 40% of their sales come from online ordering.
Question 6: How do you capture your online orders?
Analysis: Nearly 2/3 of pizza operators now have their own website ordering capability, but, surprisingly, are more likely to use third-party partners than those who don’t have online ordering of their own.
| Restaurateurs with own website online ordering capability | 62.24% |
| Restaurateurs without own website ordering capability | 37.75% |
| Restaurateurs with own website ordering AND 3rd party partners | 29.18% |
| Restaurateurs with own website ordering AND NO 3rd party | 32.45% |
| Without own website ordering capability AND 3rd party partners | 9.58% |
| Without own website ordering capability AND NO 3rd party | 28.77% |
Question 7: What percentage of sales are coming from third-party services that charge a fee?
Analysis:
| None | 51.43% |
| Less than 20% | 27.75% |
| Between 21% and 40% | 13.06% |
| Between 41 and 60% | 3.67% |
| Over 60% | 2.24% |
PMQ estimates this to be about 10% of the current pizza industry sales.
Question 8: How many of these COVID-19 best practices are you using? (Listed in order of popularity)
| Regularly and visibly wiping down sneeze guards, tables, door handles, etc. | 78.57% |
| Curbside carryout/pickup | 78.16% |
| Staff wearing food safety apparel (masks, gloves, hair nets, etc.) | 76.94% |
| No-contact prepayment | 66.73% |
| Contactless delivery | 64.49% |
| Selling take-and-bake pizza | 27.14% |
| Flyer and/or boxtop price discounts/coupons/meal deals | 25.1% |
| Offering pizza kits or home meal kits | 24.29% |
| Providing disinfectant wipes for patrons | 21.63% |
| Selling everything individually wrapped | 12.65% |
| Selling reheatable comfort meals | 9.39% |
| Selling food/supplies as groceries to the public | 8.78% |
| Conducting regular third-party food safety inspections and showing results | 6.53% |
| Other (please specify) | 6.33% |
Question 9) How optimistic are you about your business as a result of the COVID -19 crisis? Select one
| I am nervous that my business will not survive through the crisis | 11.02% |
| I am worried, but I think we will get through the crisis and emerge as strong as before | 43.65% |
| I’m optimistic we will emerge stronger than before | 34.49% |
| I’m very optimistic – my business has been stronger than ever through this crisis | 11.02% |
Analysis: In relation to question 9, this is the ratio of those in the most concerned category compared to those in the most optimistic category.
Chains: 2 out of 2 most optimistic
Franchisees 9 of 12 most optimistic
Independents 40 out of 89 most optimistic
Question 10: What kind of support would you like to see from suppliers and manufacturers?
| Marketing materials to help raise awareness level and increase traffic | 44.08% |
| Financial help | 41.02% |
| Help my customers know my restaurant is open | 38.98% |
| Support national independent pizza marketing promotions driving sales to my restaurant | 38.57% |
| Don’t need help | 17.55% |
| Advice/training with deep cleaning | 15.1% |
| Help with menu development | 14.08% |
No question: independent pizzerias need marketing help.
Question 11) Which of the following best describes your operation?
| Independent operator | 81.02% |
| Franchise operator | 11.43% |
| Chain operator | 4.49% |
| Other | 3.06% |
Question 12: What is your current position?
| Owner/President/CEO | 81.43% |
| Other (please specify) | 5.3% |
| Marketing Manager | 2.45% |
| Manager | 10.82% |
| Industry/Vendor | 0.00% |
To access to raw data from this survey, send an email request to ingrid@pmq.com.